Understanding the school overview by year submitted report
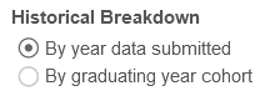
The school overview by year submitted report provides a longitudinal, aggregated school view of student performance towards meeting UC and CSU eligibility requirements. This view calculates overall A-G completion for all students submitted for the current enrollment cycle. Additionally, data can be viewed by "graduating year cohort" where A-G completion rates reflect the 9th-12th grade trajectory for the same cohort of students over time.
Longitudinal data comparison
“By year submitted” provides a longitudinal view of the data for as many years as the school or district has participated in UC Compass.
Filter options
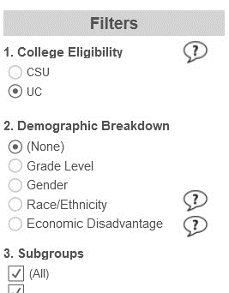
Academic year
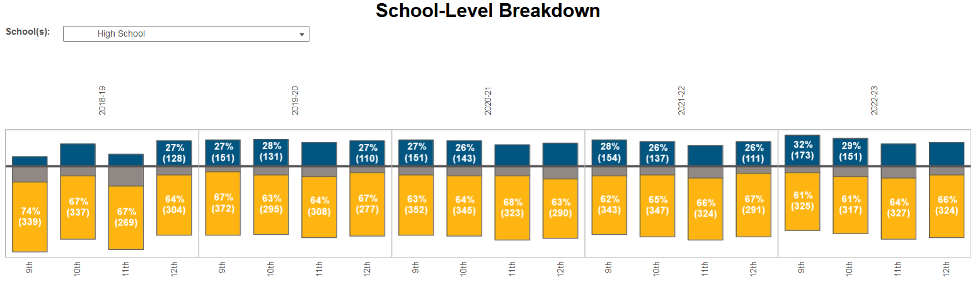
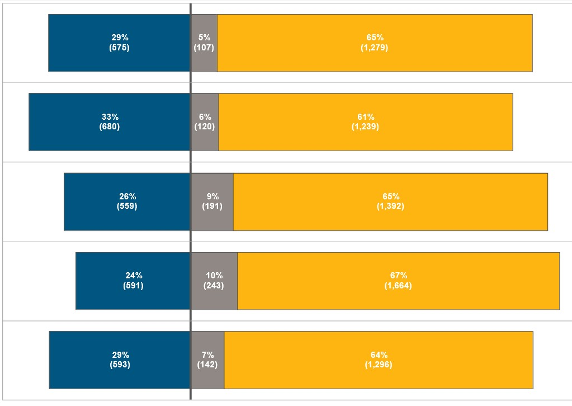
Year-over-year overall comparison
Displays the overall eligibility status of all 9-12 graders during the academic year indicated. Use the filters available to disaggregate the data and view a demographic breakdown in each year.
Year-over-year by school