Understanding the deficient grades report
This report identifies specific courses in which students are receiving the most D/F grades categorized by A-G subject areas. This data can be used to identify trends to help department chairs or instructional coaches assess if a change in curriculum, faculty or support programing is correlated to student performance.
Filter options

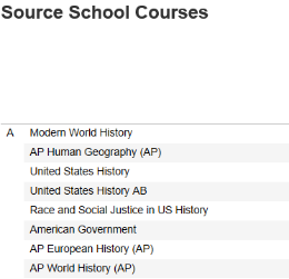
A-G courses from current school
Displays all course titles submitted in the UC Compass data file that have been verified as A-G approved and were taken by students at the evaluated school. Duplicate entries of course titles may result when multiple transcript abbreviations are submitted in the UC Compass data file that correspond to the same course title.
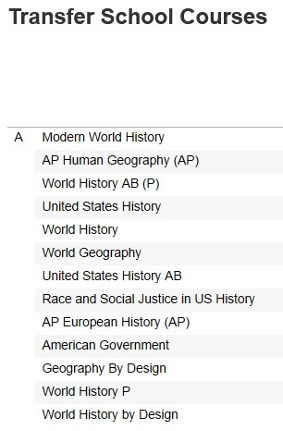
A-G courses from transfer school
Displays the total number and percentage of D’s and F’s received during the selected years, grade level and schools by students contained in the UC Compass data file. Courses taken by students in 9th and 10th grades will tend to have a higher number deficient grades because the total number of students in the data file who have taken those courses is larger (e.g. nearly all 9-12 graders will have taken an English 1 or English 9 course as opposed to an AP English Literature course that is only taken by 12th graders each year).
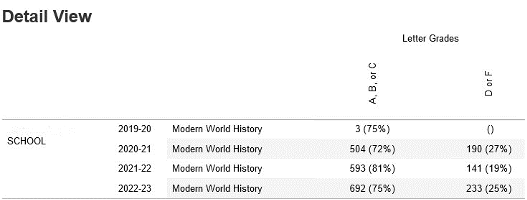
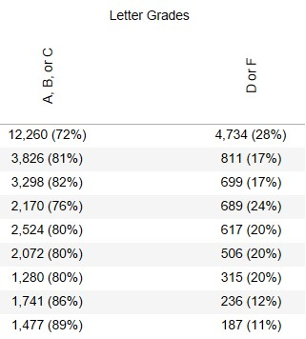
Count of letter grades by course
Detailed view by academic year/high school