Understanding the graduate year cohort report
The graduate year cohort view of the school overview report provides a comparison of academic performance for those students graduating in the same year. The data can be disaggregated by grade level, gender and race & ethnicity.
Graduate cohort comparison
Selecting “by graduating year cohort” provides a longitudinal view of the school or districtwide data for as many years as the school or district has participated in UC Compass.
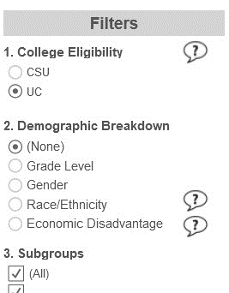
Filter options
Allows users to filter by School, UC or CSU eligibility, and Demographic data.
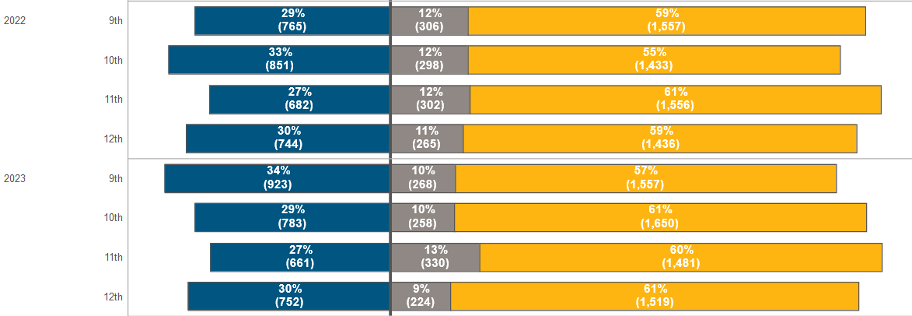
Cohort A-G completion by grade level
Shows the trajectory for a graduating high school class from start to finish. It displays the percentage and number of students in each eligibility tier from 9th through 12th grade. It illustrates where a cohort (i.e., “Class of 2023”) had significant achievement fluctuations by grade level that may be correlated to specific interventions or challenges for the specific academic year(s).
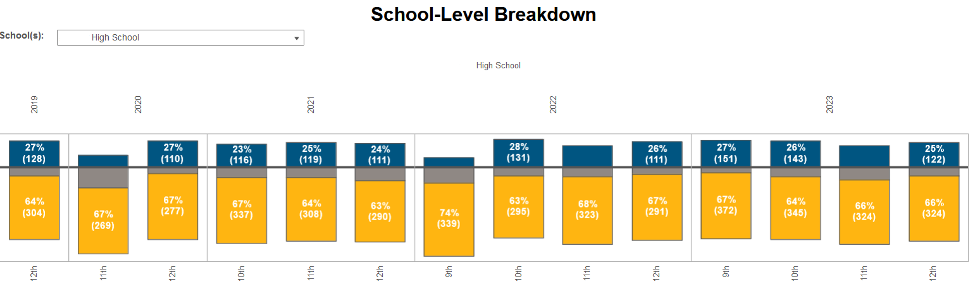
Cohort A-G completion by school
Displays the same data as above but provides a breakdown of the cohort at each high school and graduating class, if applicable. Multiple schools can also be viewed side by side.