Understanding the student roster report
This report provides all analyzed A-G data in a downloadable format that can be easily filtered to isolate specific student cohorts. For example, you can use this report to find all stduents across multiple grade levels who are deficient in one or more subject areas within a GPA range and eligibility status.
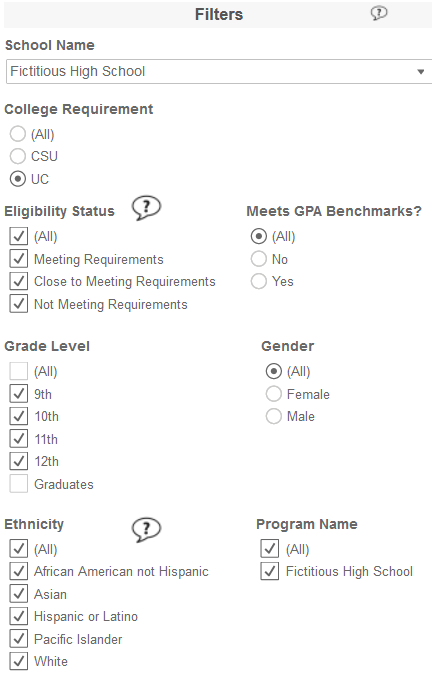
Data disaggregation filters
Allows users to filter by any combination of the following criteria: a) school b) UC or CSU eligibility c) A-G category deficiency d) student eligibility status e) grade level f) ethnicity g) GPA benchmarks h) gender i) school or district designated program (if included in the data file submitted to UC Compass).
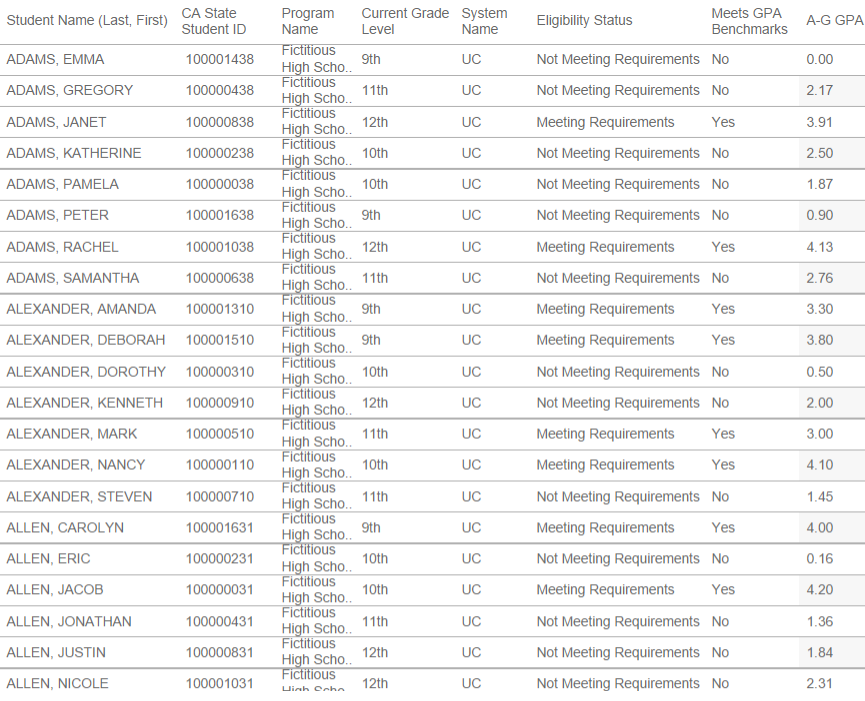
Student list
Displays the following information for all students contained in the submitted data file: a) name b) CA SSID c) program name (if any) d) grade level e) UC or CSU version f) eligibility status g) A-G GPA.
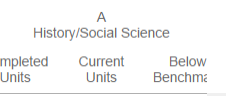
A-G subject area(s)
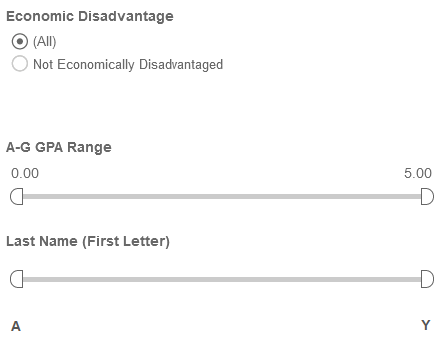
Additional filters
School upload date
Displays the date of the data file upload to UC Compass. The information in the roster is current as of this date, but please note that students who transfer into the school or district after this date may not be contained in the report.